How to Calculate New, Active & Lapsed Customers with SQL
One of the important fundamentals to growing a healthy business is understanding the customer life cycle. At a high level, the types of questions that usually begin a customer life cycle analysis range from:
- How many new customers did marketing generate over a specific time period?
- Which types of product categories or services generate more new customers?
- Are we increasing the number of active buyers over time with our marketing and other business efforts?
- Are there different buying cycles based on the type of customers we sell to?
The answers to the above questions will vary based on the industry and specific business. How quickly they can be answered will depend on the size and maturity of your organization. You might have a business intelligence group or team of analysts to answer the question for you. If not, the goal of this post is to show you how to answer these types of questions using SQL.
The data set and environment
The data set we’ll be using is Super Store and the structure of the data looks like the following. 
The environment we’ll be using to query the data with SQL is the cloud database Google Big Query. If your organization stores it’s data on-premise in a system like MS SQL Server the fundamentals still apply although the syntax of the SQL will vary.
Transforming data with SQL
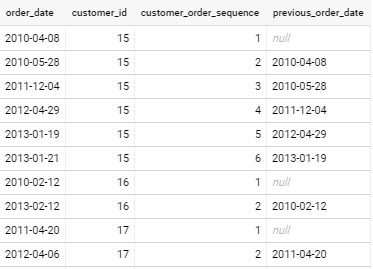
- Create an order sequence column specific to each customer ID based on the ascending order date for that customer. This is what the ROW_NUMBER analytic function is doing in the below query.
- Create a new column that inserts the previous order date for a customer ID to be used in a later code block for calculating the time period between orders. This is what the LAG Analytic function is doing in the below query.
*Note the “Group By” order_date and customer_id columns at the end of the statement. This is important because a customer can have multiple orders with different order ids on the same day
SELECT
   order_date,
   customer_id,

   ROW_NUMBER() OVER (PARTITION BY customer_id ORDER BY
   order_date ASC) as customer_order_sequence,

   LAG(order_date) OVER (PARTITION BY customer_id ORDER BY
   order_date ASC) as previous_order_date,

   FROM personal-264822.superstore.orders
   GROUP BY order_date, customer_id
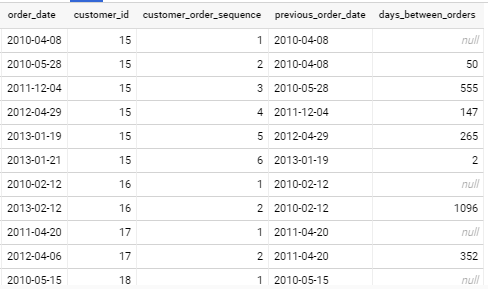
3. Run a sub-query against the above table to calculate the days between the order_date and the previous_order_date columns, you’ll see this happening with the DATE_DIFF function that creates the new column days_between_orders.
SELECT
   order_date,
   customer_id,
   customer_order_sequence,

   CASE WHEN previous_order_date IS NULL THEN order_date
   ELSE previous_order_date END AS previous_order_date,

   DATE_DIFF(order_date, previous_order_date, DAY) AS
   days_between_orders

   FROM order_sequence
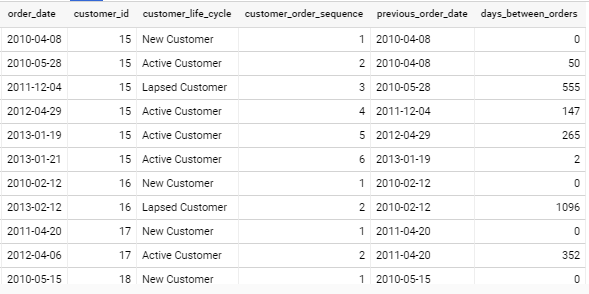
4. The next query creates an additional customer_life_cycle column with a CASE statement to indicate if the order is from a New, Active or Lapsed customer based on the days_between_orders column. In this example, a customer is considered ACTIVE if the order takes place anytime between 1 to 365 days from the previous order and LAPSED if the prior order was greater than 365 days ago. This highly business specific so yours may vary.
SELECT
 order_date,
 customer_id,

 CASE
 WHEN customer_order_sequence = 1 THEN 'New Customer'
 WHEN days_between_orders > 0 AND days_between_orders < 366 THEN 'Active Customer'
 WHEN days_between_orders > 365 THEN 'Lapsed Customer'
 ELSE 'Unknown'
 END AS customer_life_cycle,

 customer_order_sequence,
 previous_order_date,

 CASE
 WHEN days_between_orders IS NULL THEN 0
 ELSE days_between_orders
 END AS days_between_orders

 FROM time_between_orders
5. The output of the three SQL statements can then be joined back to the original Super Store table with the additional attributes about the customer and orders.
Note: for the final query using a WITH clause to organize the query into distinct virtual table blocks to help organize and keep the statement readable.
WITH

order_sequence AS (

  SELECT
  order_date,
  customer_id,
  ROW_NUMBER() OVER (PARTITION BY customer_id ORDER BY
  order_date ASC) as customer_order_sequence,
  LAG(order_date) OVER (PARTITION BY customer_id ORDER BY
  order_date ASC) as previous_order_date,
  FROM `personal-264822.superstore.orders`
  GROUP BY order_date, customer_id),

time_between_orders AS (

   SELECT
   order_date,
   customer_id,
   customer_order_sequence,
   CASE WHEN previous_order_date IS NULL THEN order_date
   ELSE previous_order_date END AS previous_order_date,
   DATE_DIFF(order_date, previous_order_date, DAY) AS
   days_between_orders
   FROM order_sequence),

customer_life_cycle AS (

  SELECT
   order_date,
   customer_id,

   CASE
   WHEN customer_order_sequence = 1 THEN 'New Customer'
   WHEN days_between_orders > 0 AND days_between_orders < 366
   THEN 'Active Customer'
   WHEN days_between_orders > 365 THEN 'Lapsed Customer'
   ELSE 'Unknown'
   END AS customer_life_cycle,

   customer_order_sequence,
   previous_order_date,

   CASE
   WHEN days_between_orders IS NULL THEN 0
   ELSE days_between_orders
   END AS days_between_orders

   FROM time_between_orders)

SELECT
t1.order_date,
t1.customer_id,
t2.customer_life_cycle,
t2.customer_order_sequence,
t2.days_between_orders,
t1.order_id,
t1.sales,
t1.profit,
t1.customer_segment,
t1.product_category,
t1.product_sub_category,
t1.region,
t1.state_or_province,
t1.city

FROM `personal-264822.superstore.orders` AS t1

LEFT JOIN customer_life_cycle AS t2

ON
(t1.customer_id=t2.customer_id
AND t1.order_date=t2.order_date) 
Summary
We now have a data view that shows the customer life cycle for every transaction. The next step would be summarizing the data to generate insights. The next post will cover how to visualize this data in a service like Tableau or Data Studio.
Wow, this advanced query help me a lot!
It’s clearly enough to be adapted to any business model based on customers analytics. Thank you!
Thank you, It was very helpful